


Banking Management Reports for Today
Financial institution executives are reporting increased or significant concerns about interest rates, credit risk and liquidity — worries that only add to the number of figurative plates they are spinning. How can banks quickly spot warning signs so they can act during volatile economic, industry and institutional conditions?
Data-driven decisions for managing financial institution risk while driving growth and increasing efficiency are especially important given the recent failures of Silicon Valley Bank, First Republic Bank, and Signature Bank of New York. With headlines like “banking crisis” and “bank runs,” customers, employees and other stakeholders are looking for any sign that another bank is in trouble — even if the institution is not facing the unique circumstances leading to those banks’ collapses. Naturally, all financial institutions come under increased regulatory scrutiny after such newsworthy events as those, too.
In addition, even before the recent banking troubles, regulators have emphasized the financial institution’s responsibility to provide leaders with information on key areas of planning, operations and risk management. An OCC Reference Guide to Board Reports and Information, for example, says that “directors should look at individual, peer and industry performance measures as well as the trend and interrelationships among capital, asset quality, earnings, liquidity, sensitivity to market risk and balance-sheet changes.”
Financial Institution Information for Assessing, Managing Risk
Where to start? Below are 10 reports banks should run and review to assess capital, growth and liquidity. The reports for banking management are grouped into three major areas of focus, while all are connected.
Reports for Assessing Bank Capital
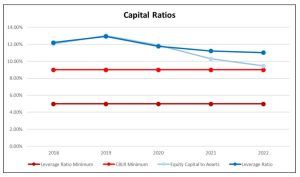
Capital ratios reports assess the sufficiency of an institution’s ability to absorb losses. Regulators review them to assess safety and soundness. Shareholders care about them from an earnings and return viewpoint since increased capital needs can affect strategic planning, growth plans, dividends and, ultimately, stock price.
A report that allows a financial institution to identify warning signs that it is approaching minimum regulatory requirements for capital compares the institution’s equity capital to assets and its total leverage ratio (core capital) with the minimum regulatory requirement (e.g., the Community Bank Leverage Ratio (CBLR) and the minimum Tier 1 leverage ratio). The capital ratios report helps ensure the institution maintains capital commensurate with the level and nature of risks to which it is exposed. Capital is impacted by growth and liquidity, so it is essential to look at these graphs holistically. In addition, keep in mind the necessity to drill down into these more general graphs to gain better insight into underlying issues.
Growth Reporting on the Balance Sheet To Identify Imbalances
Four reports focused on growth to run and review in comparison with peers are:
- Asset growth rate
- Loan growth rate
- Deposit growth rate
- Core deposit growth rate
These reports show how a financial institution is growing components of each side of the balance sheet to identify potential imbalances that may prompt the need for additional funding or liquidity.
Deposit analysis provides insight on surge balances as well as non-core versus core deposits, which are more stable sources of funding for loan growth. Core deposits in growth reports for financial institutions should be defined in a variety of ways. For example, the UBPR defines core deposits as the sum of demand deposits, all NOW and ATS accounts, MMDA savings, other savings deposits, and time deposits under $100,000. Still, it is vital to consider depositor behavior as well when defining what really is a core deposit.

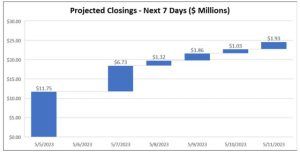
A report designed to identify growth opportunities as well as flag liquidity needs is one showing the loan pipeline according to when loans are projected to close and fund. Showing projected loan fundings over the next week, for example, helps the CFO or other staff involved in liquidity management to plan anticipated funding needs to support loan originations. This report requires (and therefore improves) communication between the credit and lending area of the bank and those responsible for liquidity management.
Monitor Liquidity Risk With Regular Reporting
Capital and liquidity go hand in hand, as the industry saw with the recent bank failures. In the case of Silicon Valley Bank (SVB), the bank needed liquidity fast due to significant depositor withdrawals and had to liquidate its securities portfolio. The sale depleted its capital because SVB was in a large unrealized loss situation on its held-to-maturity investment securities.
Three types of reports to monitor liquidity risk are those evaluating:
- Liquid assets
- Core deposits
- Short-term investments
First, monitor liquid assets and those that can be liquidated quickly with few adverse consequences. Measure liquid assets as a percentage of total assets and evaluate this ratio relative to peers.
Second, track core deposits as a percentage of total assets and evaluate this relative to peers. Core deposits should be assessed not only by deposit type (e.g., transactional accounts like CDs versus primary checking accounts) but also in terms of balances to identify surge balances. In addition, it’s useful to discern the migration of deposit funds from existing depositors (i.e., the movement of money out of money market funds to CDs versus new deposit money coming in).
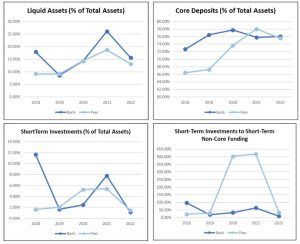
Monitoring short-term investments is another important radar for liquidity risk and issues.
Two reports to run are:
- Short-term investments as a percent of total assets
- Short-term investments vs. short-term non-core funding
Again, comparing the bank’s ratios to those of peers provides useful context. The liquidity risk reports can identify areas of concern and help the institution prepare in the event it must liquidate any of the portfolio. Evaluating short-term investments can also identify the need to overhaul or adjust investment and liquidity policies to better pivot under more stressed economic environments.
Additional Analytics for Guiding Financial Institution Decisions
Additional analytics useful in the current environment include reports on investment growth, investment duration and unrealized loss positions in the investment portfolio. It is also important to consider the more granular aspects of the broader categories shown in the graphs herein. A good reporting solution allows the analyst to drill down into the underlying data and slice the data by product, individual customer, geographic location and more.
All the reports above highlight areas that are especially key to monitor considering recent bank failures: capital, growth and liquidity. However, other reports beyond the scope of this article can help a financial institution and its directors assess and plan. For example, ongoing reports related to profit, asset quality and yields versus costs provide critical information for better managing the bank.
Access Data for Bank Reporting
As previously described, data can drive risk and growth decisions. A common challenge among banks, however, is being able to provide leaders with data that is actually meaningful.
Many financial institutions store the information needed to spot trends and red flags across their core systems, spreadsheets, loan tapes and other disconnected data sources. Banks may lack the talent or infrastructure for dedicated data warehousing and data science. As a result, quickly and efficiently delivering basic snapshots focused on liquidity, capital and growth isn’t possible at these institutions, and it becomes even more complex as the bank grows.
In addition, some forms of data yield little in the way of insights that can drive action. They simply add clutter to the noise of the workday. Financial institutions need help sifting through mountains of data so they can derive value and take action.
A banking intelligence solution purpose-built for banks should combine analytics and intuitive dashboards to make it easier to make data-driven decisions. It should provide an improved understanding and point staff in the direction of opportunities to better manage credit risk, liquidity risk, market risk and compliance risk, including the effectiveness of the institution’s programs for preventing money laundering and fraud.
For example, leveraging archived loans as well as loan pipeline data can provide an early warning system of concentration risk or a projection of future concentration risk so that management and the board can make proactive credit risk management decisions. Curated insights into sources of risk can show which customer types are contributing to additional work related to anti-money laundering/countering the financing of terrorism (AML/CFT) compliance. Visualizing the institution’s lending footprint can lead to improved targeting of growth areas.
A banking intelligence system that provides dashboards that are based on roles within the financial institution paves the way for better decisions from the top down and from the bottom up.
Unlike spreadsheets or complicated business intelligence tools, this kind of banking intelligence makes it easier to assess institutional performance, increase employee performance, unlock opportunities for growth and anticipate future risks.